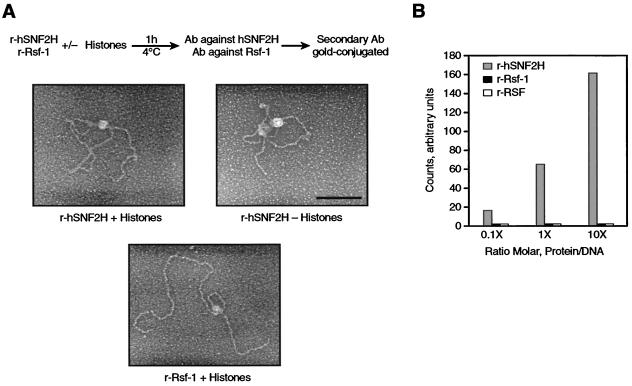
FIG. 5.
DNA-binding activity. (A) Electron microscopic visualization of the binding of RSF subunits to DNA. The experiment was carried out as shown on the top of the figure. hSNF2H or Rsf-1 were incubated with EcoRI-linearized plasmid. The products of the reactions were first incubated with antibodies against hSNF2H or Rsf-1. This was followed by incubation with a secondary antibody conjugated with 10-nm gold, as described in Materials and Methods. In each image, the white dot found in the middle of the large protein complex corresponds to the gold particle. The top panels show the products of the reaction with hSNF2H visualized by electron microscopy in the presence (left) or absence (right) of histones. The bottom panel shows the products of the reaction with Rsf-1 in the presence of histones. Bar, 100 nm. (B) DNA filter-binding assay. Increasing amounts of recombinant hSNF2H, Rsf-1, and recombinant RSF obtained by coexpression of the subunits were incubated with radiolabeled DNA at the indicated molar ratio. The figure shows the quantification of DNA bound to the nitrocellulose filters as explained in Materials and Methods. This figure represents three independent experiments.

