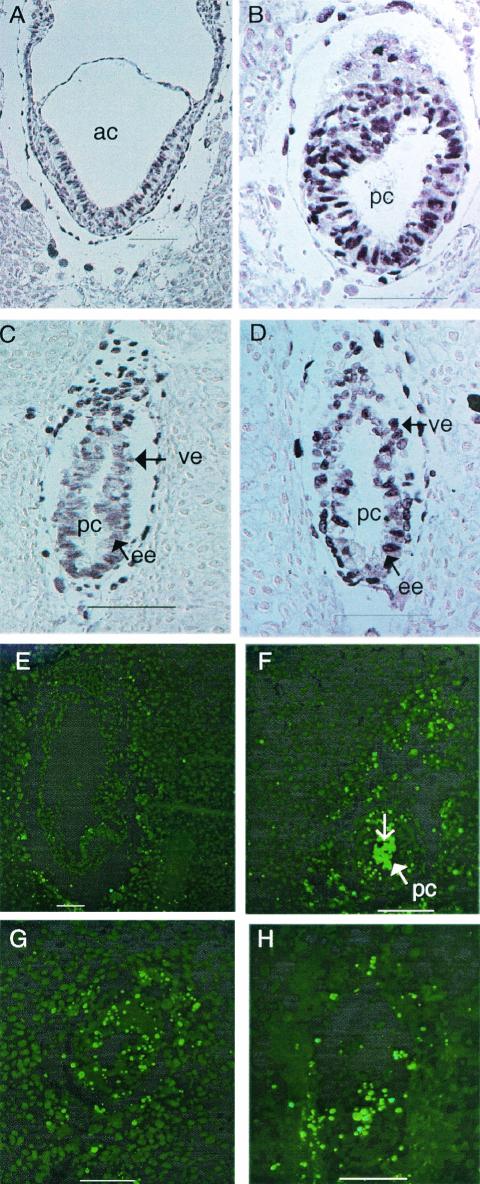
FIG. 7.
Bromodeoxyuridine and TUNEL analysis. (A, B, C, and D) Bromodeoxyuridine labeling of normal (A and C) and mutant (B and D) 7.5 dpc (A and B) and 6.5 dpc (C and D) embryos. (E, F, G, and H) TUNEL staining of 7.5 (E, F, and G) and 6.5 dpc (H) embryos. There is almost no signal in the normal control embryo (E). (F, G, and H) Mutants. Note strong staining inside the proamniotic cavity (open arrow). Embryos in panels A and B are from the same litter, as are those in panels E and F. ac, amniotic cavity; ee, embryonic ectoderm (or epiblast cells); pc, proamniotic cavity; ve, visceral endoderm. Bars, 100 μm.

