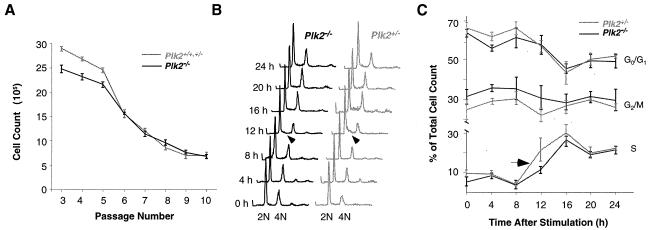
FIG. 5.
Analysis of proliferation of cultured embryonic fibroblasts. (A) Cell proliferation assays. The cells were counted after 48 h of incubation. Values were calculated from one Plk2+/+, two Plk2+/−, and three Plk2−/− cell lines derived from a single litter. The results are representative of three independent experiments. The error bars indicate standard deviations. (B) FACS analysis of cell cycle progression after serum stimulation. Times after serum stimulation are shown on the left, and G1 (2N) and G2/M (4N) cell populations are indicated. The arrowheads point to differences between the S-phase cell populations in Plk2−/− and Plk2+/− cells. (C) Summary of FACS analyses of five Plk2−/− and three Plk2+/− cell lines from two independent experiments. A rapid increase in the S-phase cell population in Plk2+/− cells from 8 to 12 h after serum stimulation is indicated by an arrow.

