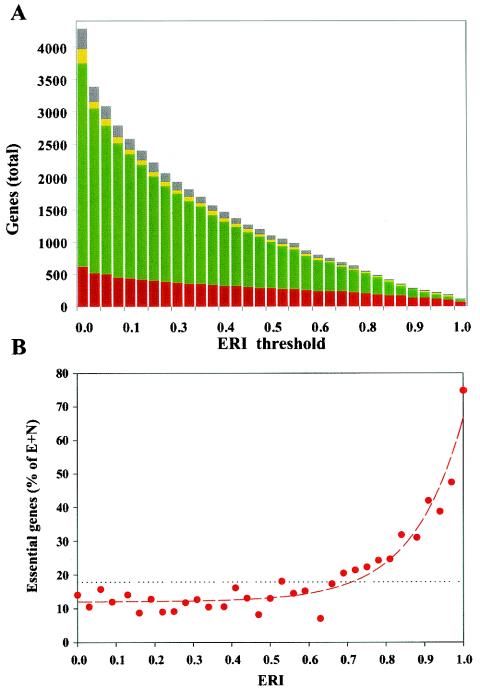
FIG. 3.
Distribution of E. coli genes as a function of ERIs. (A) Total number of genes with an ERI above the threshold plotted versus the ERI threshold. Color coding within bars represents fractions of essential (red), nonessential (green), ambiguous (yellow), and missing (gray) genes for each incremental increase of ERI threshold (with 33 diverse genomes in the reference set). (B) Fractions of essential genes at different ERI values. The data were fitted with the following function: y = yo+aebx, where yo is 12.0 ± 0.9, a is 0.023 ± 0.019, and b is 7.8 ± 0.8 (dashed red line). The dotted line represents the fractions of essential genes for the whole genome. (The fractions plotted are defined as the number of essential genes versus the number of essential (E) and nonessential (N) genes. Unknown or ambiguous genes are not taken into account.)

