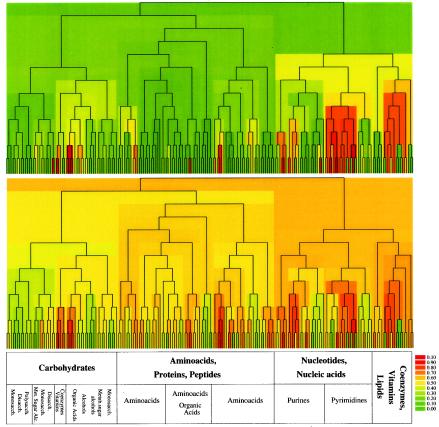
FIG. 6.
The evolutionary retention and essentiality ratio of enzymes in the topologic modules of E. coli metabolism. The hierarchical tree derived from the topologic overlap matrix of E. coli metabolism that quantifies the relation between the various modules is shown, as previously described (28). The branches of the tree are color coded according to the fraction of essential enzymes (top panel) and the average ERI score of enzymes (bottom panel) catalyzing the biochemical reactions within a given topologic module. Red indicates a 100% essentiality/conservation ratio within a module. Note that essentiality is not uniformly distributed across all modules (branches), but we observe a few small modules with very high fractions of essential enzymes, while the majority of modules contain no or only a few essential enzymes. A similar segregation of modules with high evolutionary conservation is observed in the second panel, with their locations often correlating with those of the high essentiality modules. The predominant biochemical classes of substrates used to group the metabolites are shown. Polysacch., polysaccharide; disacch., disaccharide; monosacch., monosaccharide; met. sugar alc., metabolic sugar alcohols.

