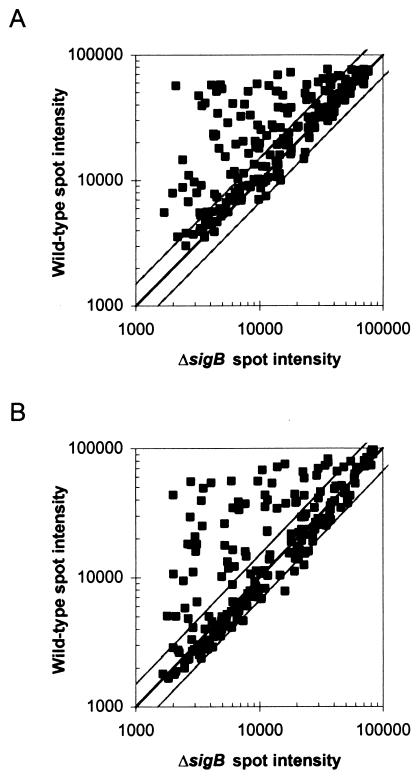
FIG. 1.
Scatter plots of normalized microarray spot intensities for wild-type and sigB mutant strains. The center line depicts equal expression in both strains. Outer lines depict 1.5-fold higher expression in either strain. Spot intensities were normalized as described in the text. Data for each gene represent the averages of three replicate spots from each of four hybridizations. RNA for microarray experiments was isolated from (A) stationary-phase cells or (B) osmotically stressed cells.

