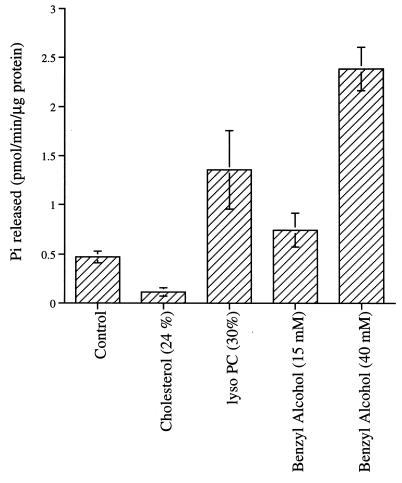
Figure 2.
Effect of membrane fluidity modulators on G protein GTPase activity. The histogram shows basal GTPase activity (37°C, 1 min) of G proteins reconstituted with control (PE/PS; 6:4, mol/mol), cholesterol (PE/PS/cholesterol; 4.5:3:2.5, mol/mol), and LPC (PE/PS/LPC; 4.2:2.8:3, mol/mol). Benzyl alcohol was added to control liposomes (PE/PS, 6:4). The values presented here are mean ± SD of three measurements.

