
Fig. 1.
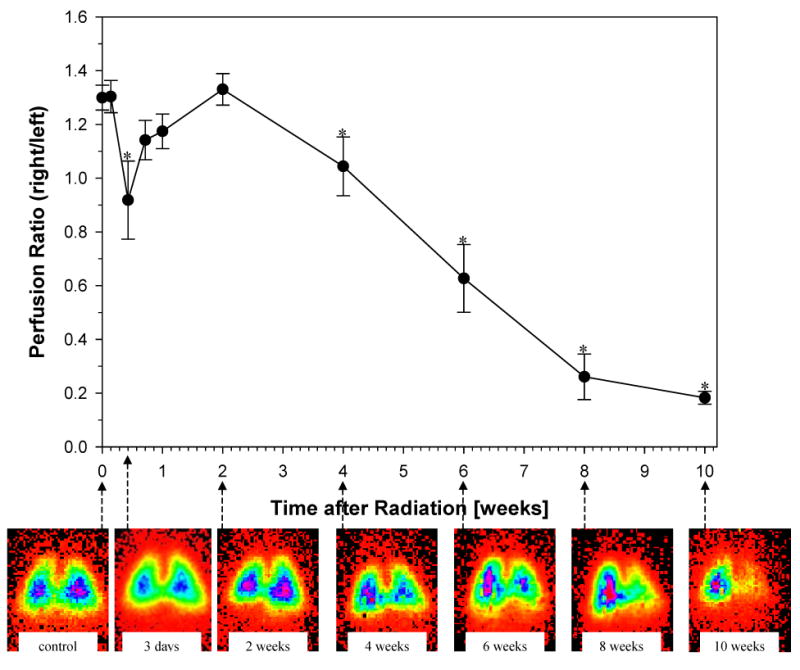
Time related changes in lung perfusion after 28 Gy single dose irradiation to the right hemithorax of rats. Mean perfusion ratio (see Methods) as a function of time (at pre-irradiation time point, T=0, for a period of 10 weeks post-irradiation). A significant decrease in lung perfusion was observed 3 days after irradiation (p=0.0322). After a short recovery period lung perfusion progressively declined from the 2 week post-irradiation time point, until the conclusion. Data are represented as mean (± 1 SEM) observed in 10 animals per time point. *p<0.05 compared with no radiation. Representative scintigraphic images (see Methods) in one animal at pre-irradiation (control) and throughout the 10 week time-course (3 days – 10 weeks) are shown for comparison. Color ramp is used to demonstrate radiolabled perfusion marker with activity levels from low to high indicated by orange < yellow < green < blue < majenta.