
Figure 2.
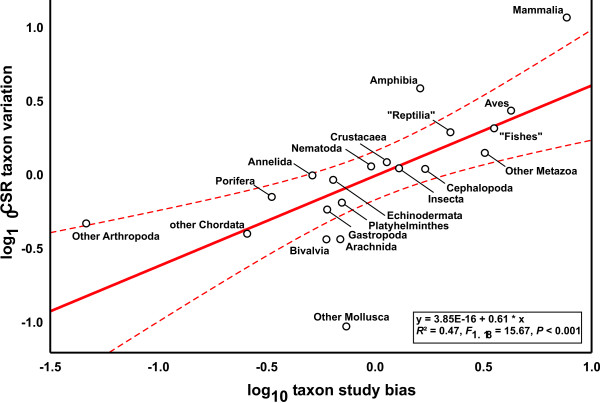
Regression of CSR taxon variation on taxon study bias for 19 metazoan taxa. Dashed lines represent 95% confidence intervals.
Official websites use .gov
A
.gov website belongs to an official
government organization in the United States.
Secure .gov websites use HTTPS
A lock (
) or https:// means you've safely
connected to the .gov website. Share sensitive
information only on official, secure websites.
Regression of CSR taxon variation on taxon study bias for 19 metazoan taxa. Dashed lines represent 95% confidence intervals.