
Figure 3.
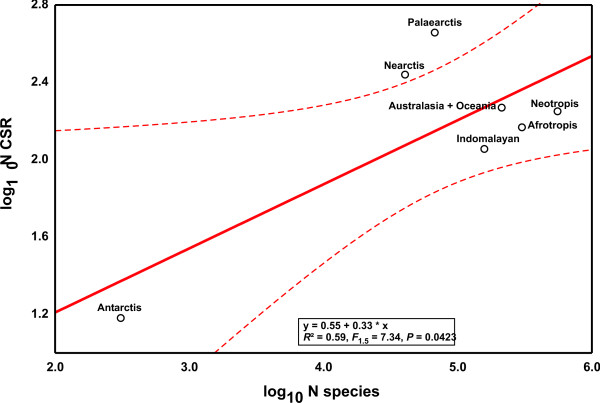
The log10 of CSR as a function of the log10 number of described species in the respective region. Deviations from the regression line represent CSR region variation. Dashed lines represent 95% confidence intervals.
Official websites use .gov
A
.gov website belongs to an official
government organization in the United States.
Secure .gov websites use HTTPS
A lock (
) or https:// means you've safely
connected to the .gov website. Share sensitive
information only on official, secure websites.
The log10 of CSR as a function of the log10 number of described species in the respective region. Deviations from the regression line represent CSR region variation. Dashed lines represent 95% confidence intervals.