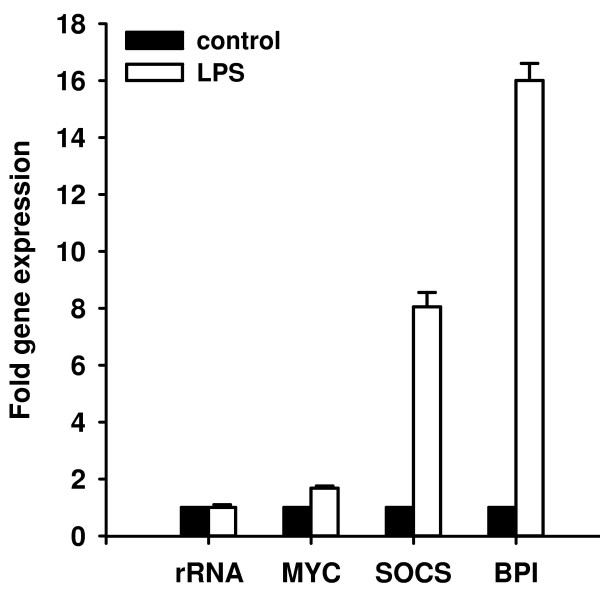
Figure 7.
Quantitative real-time RT-PCR analysis of transcriptional levels of selected Platynereis genes in response to immune challenge. The mRNA levels of selected genes in immune challenged animals (black bars) were determined and are shown relative to their expression levels in untreated animals (white bars). The transcription rates of myc, SOCS, and BPI genes were found to be increased over 1.6, 8, and 16 fold, respectively, in response to LPS injection. In contrast, the amount of 18 S rRNA transcripts were not significantly influenced. Results represent mean values of three independent determinations ± S.D.

