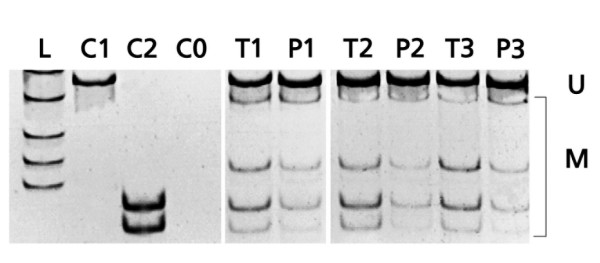
Figure 2.
Methylation analysis of paired tumor and normal kidney samples using COBRA. The degree of methylation in kidney samples was analyzed using COBRA and video densitometry for determination of methylated (M) and unmethylated (U) band signals: L, length marker; C1, negative methylation control (plasmid pCU); C2, positive methylation control (plasmid pCM); CO, negative control; T1 – T3, tumoral and P1 – P3, normal paired tissue samples.

