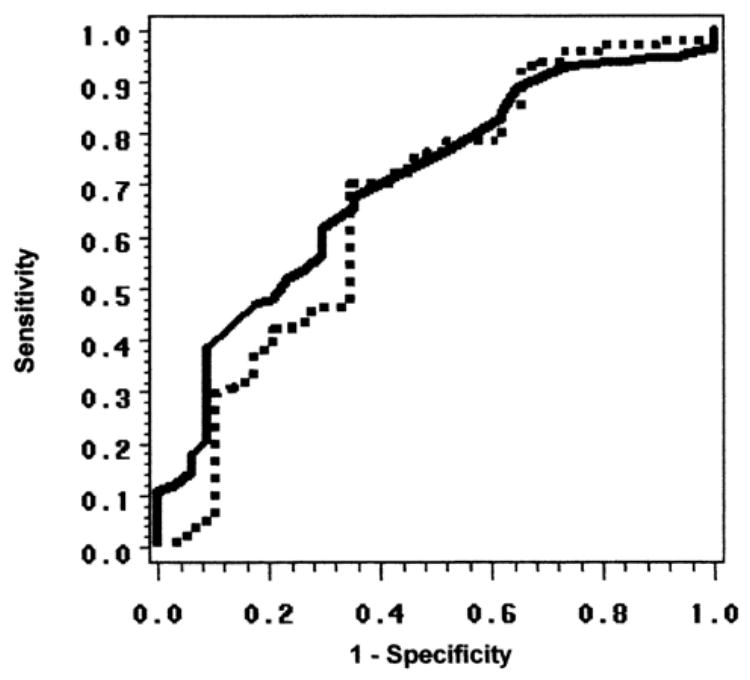
Figure 4.

Receiver operator characteristic (ROC) curve for cup-to-disc area ratio (ACDR) measured by Discam (continuous line) and the Heidelberg Retina Tomograph (HRT) for distinguishing between glaucoma and normal subjects; areas under the ROC curves (AROCs) are 0.70 and 0.67, respectively. These curves are shown as examples of ROC curves summarized by AROCs in Tables 5 and 6.
