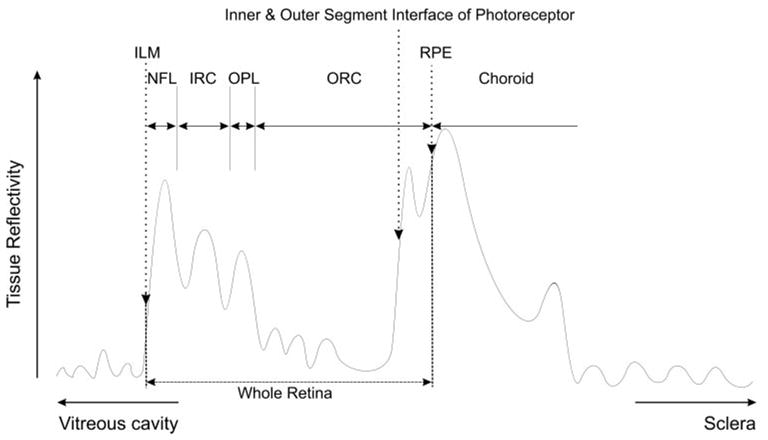
Figure 2.

Segmentation of a sampling line shows a typical sampling line (analogous to an ultrasound A-scan line) plot of tissue reflectivity. The first increase from the noise level was registered as the ILM. The second major peak is RPE complex. The first increase within the RPE complex was the interface between inner and outer segments of the photoreceptors. The RPE was a gap or notch posterior to the interface. Retinal layer structures (NFL, IRC, OPL, and ORC) were defined between the ILM and the interface. The locations of the borders were determined with an adaptive thresholding technique, where cutoff threshold values were calculated based on reflectivity characteristics of each sampling line.
