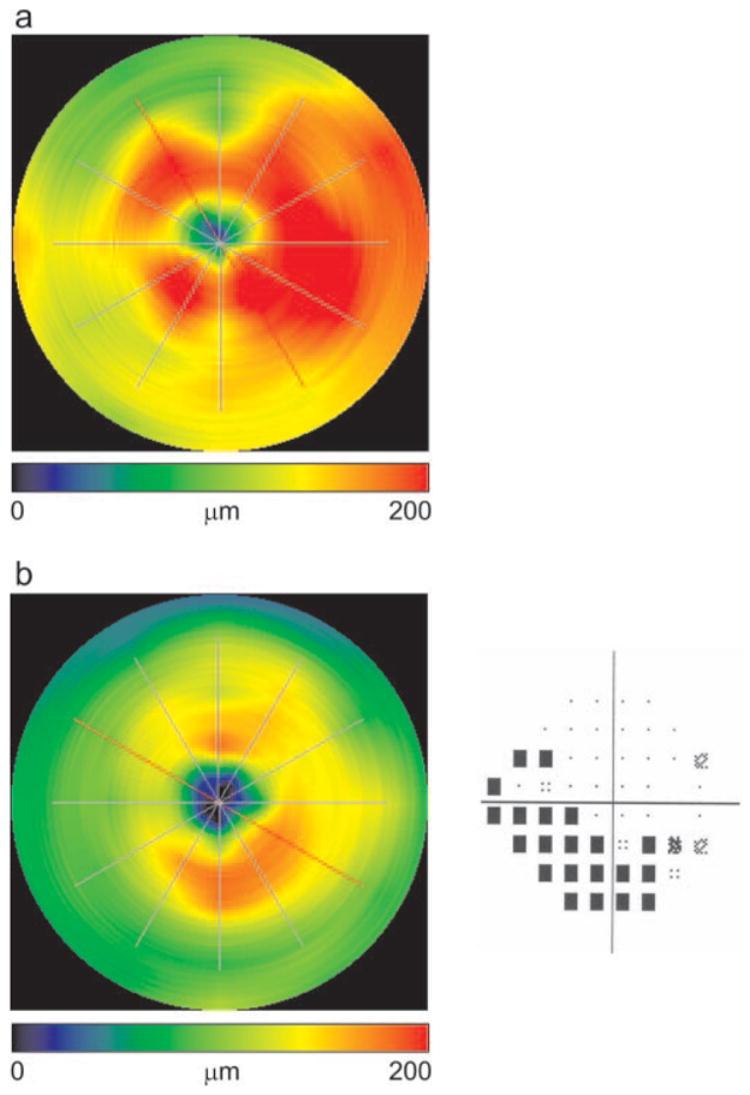
Figure 5.

Color macular segmentation mapping. (a) NFL+IRC thickness mapping on a normal eye (OD). A C pattern thickening was clearly seen, where the nasal region was thicker in the papillomacular bundle than the temporal region. Mean NFL+IRC thickness was 123.9 μm. (b) NFL+IRC thickness map on a glaucomatous eye (OD) and the corresponding SITA visual field (MD −10.8 dB, PSD 11.3 dB). Superior NFL+IRC thinning was depicted clearly, which agreed with the inferior arcuate visual field defect pattern. Mean NFL+IRC thickness was 99.1 μm.
