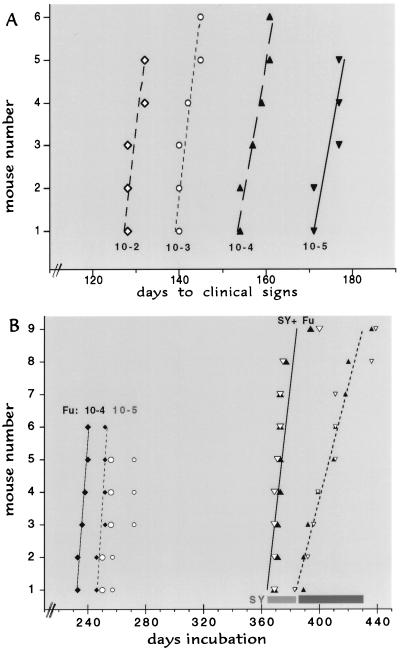
Figure 1.
(A) Interval to clinical disease of FU homogenates (10−1) in serial 1:10 dilutions. Day 1 is the inoculation day. Lines indicate the best fit in each experimental group, where the incubation in every inoculated mouse is shown by a single point. As derived (31), the effective doubling time ti = [ln 2/ln(titer end/titer start)] × the interval in days. Thus, for example, the 45-day interval for a 1:1,000 dilution of FU yields a ti of 4.5 days. (B) Predicted times for FU clinical and terminal disease at 10−4 (diamonds with solid and dotted lines, respectively) and at 10−5 (large and small open circles, respectively). Horizontal bars at right show the range of all control mice inoculated with SY only at 10−2 (light for clinical signs and dark for terminal illness). SY vaccinated mice challenged with a dilution of 10−4 (5,000 IU) of FU at clinical and terminal disease (large and small solid triangles respectively) and with FU diluted 10−5 (large and small open triangles) are within the range of SY controls, with the best-fit lines for the SY + FU 10−4 mice at clinical (solid line) and more terminal (dotted line) illness shown. Although some superinfected mice were sacrificed earlier during the clinical phase, the median distance between solid and dashed lines in superinfected mice was significantly longer (P < 0.001) than in FU controls.

