Figure 7.
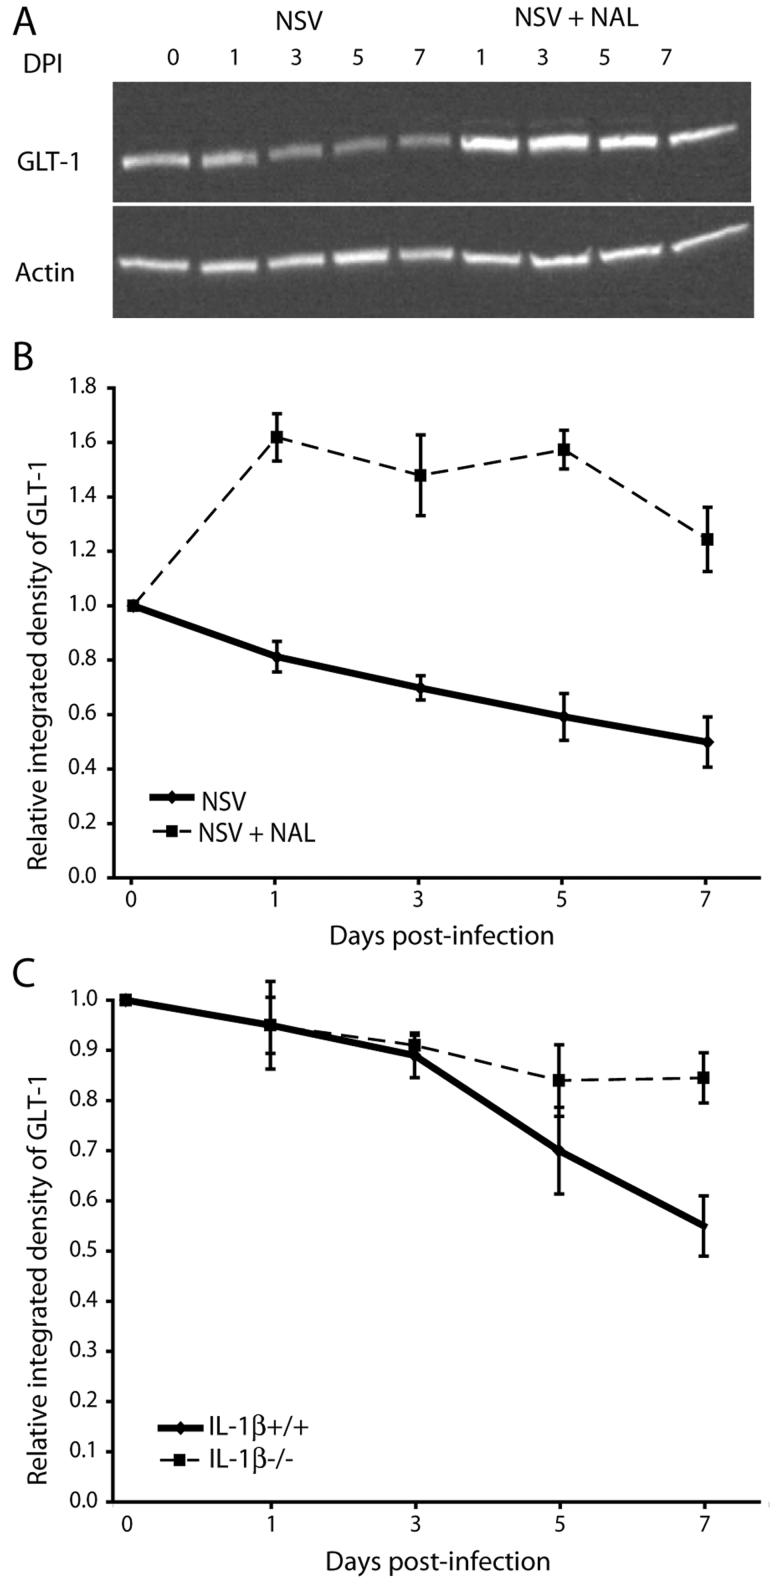
NAL treatment (50 mg/kg/day) influences SC expression of the astrocyte glutamate transporter GLT-1 during NSV infection. (A) GLT-1 and actin expression in lumbar SC lysates from mice with or without NAL treatment at different days post-infection (DPI). (B) Quantification of GLT-1 expression relative to actin expression in NAL-treated animals (broken line) compared to saline-treated controls (solid line) normalized to expression levels in uninfected controls. Each point represents the mean ± SEM of the relative integrated density of GLT-1 for 3 animals. (C) Quantification of GLT-1 expression relative to actin expression in lumbar SC lysates from IL-1β−/− (broken line) and IL-1β+/+ (solid line) animals. Each point represents the mean ± SEM of the relative integrated density of GLT-1 calculated from 3 animals at each time point and normalized to actin expression.

