
Figure 5.
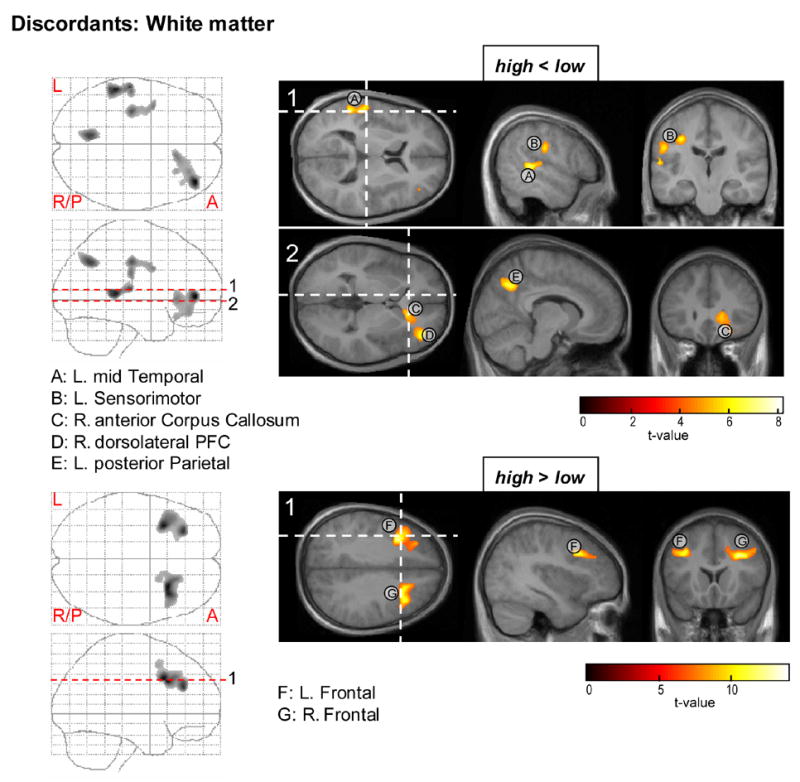
Statistical maps for the within subject ANOVA test on white matter deficits (top) and enhancements (bottom) in the CBCL-AP high versus low discordants. PFC = prefrontal cortex.
Official websites use .gov
A
.gov website belongs to an official
government organization in the United States.
Secure .gov websites use HTTPS
A lock (
) or https:// means you've safely
connected to the .gov website. Share sensitive
information only on official, secure websites.
Statistical maps for the within subject ANOVA test on white matter deficits (top) and enhancements (bottom) in the CBCL-AP high versus low discordants. PFC = prefrontal cortex.