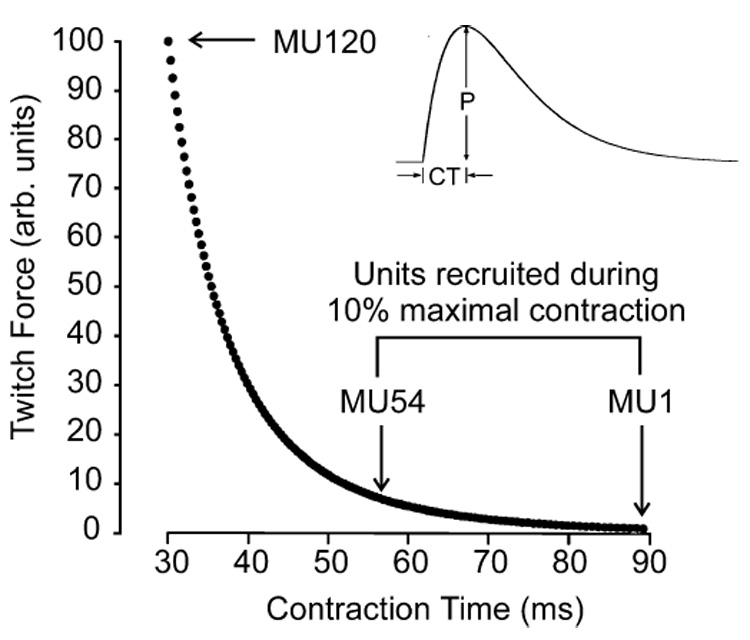
Fig. 1.

Twitch properties of simulated motor units based on the model of Fuglevand et al. (1993). The twitch force of each motor unit was simulated as the impulse response of a critically damped 2nd order system (inset). Each of the 120 motor units within the simulated muscle was assigned unique values of twitch contraction time (CT) and peak twitch force (P) such that weakest motor unit (MU1) had the longest contraction time and the strongest motor unit (MU120) had the briefest contraction time. For the present simulations, excitatory drive to the motor neuron pool was set at 10% of the maximum excitation, which caused the weakest 54 motor units to be recruited
