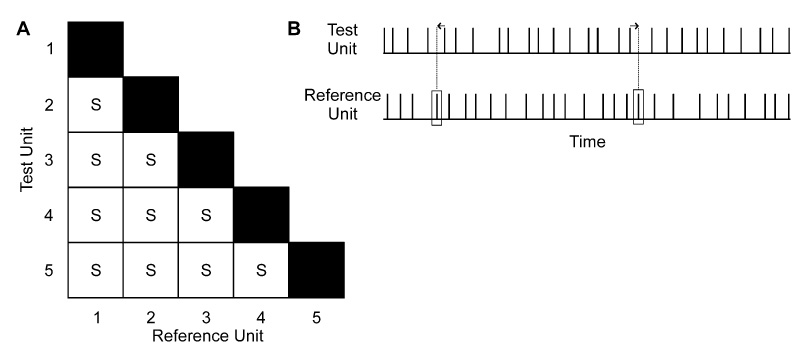
Fig. 2A, B.

Schematic diagram depicting method used to add synchrony to motor unit activity. A shows matrix of motor‐unit pair combinations to which synchrony (S) was added within a muscle. For each combination, one unit was designated as the reference unit and the other as the test unit. For randomly selected discharges of the reference unit (rectangles, B), the nearest discharge of the test unit was shifted (arrows) to coincide with the reference unit discharge. The average frequency of these adjustments to impose synchrony within a muscle was 0.6 adjustments/s, a value that roughly corresponds to the frequency of extra synchronous discharges observed for pairs of motor units in human hand muscles
