
Fig. 3.
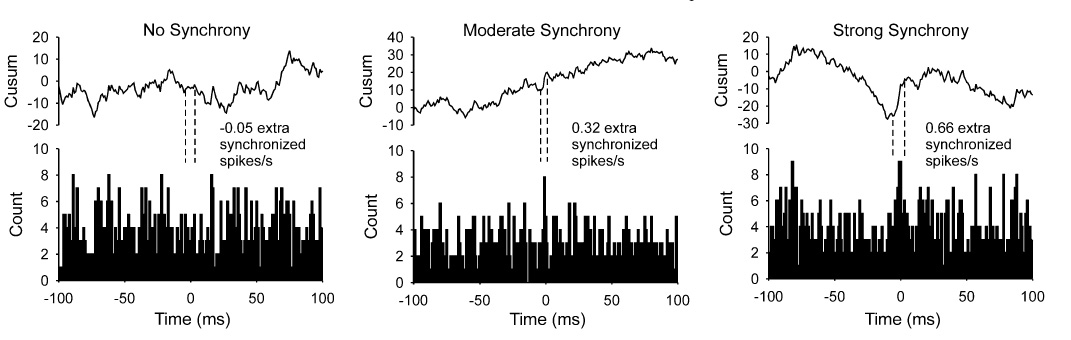
Example cross‐correlation histograms. Cross‐correlation histograms (lower row) and associated cumulative sum (cusum, upper row) for randomly selected pairs of motor units (one unit from each muscle) for the three across‐muscle synchrony conditions: no synchrony, moderate synchrony, strong synchrony. The duration of the trials used for these examples was 30 s. Dashed vertical lines indicate the limits of the peak in the histogram as estimated from the cusum for the moderate and strong synchrony conditions. For the no‐synchrony condition, the dashed lines denote an 11‐ms window centered on time 0. The number of counts within the delimited region in excess of the mean level were divided by the duration of the trial to obtain the rate of extra synchronous spikes/s