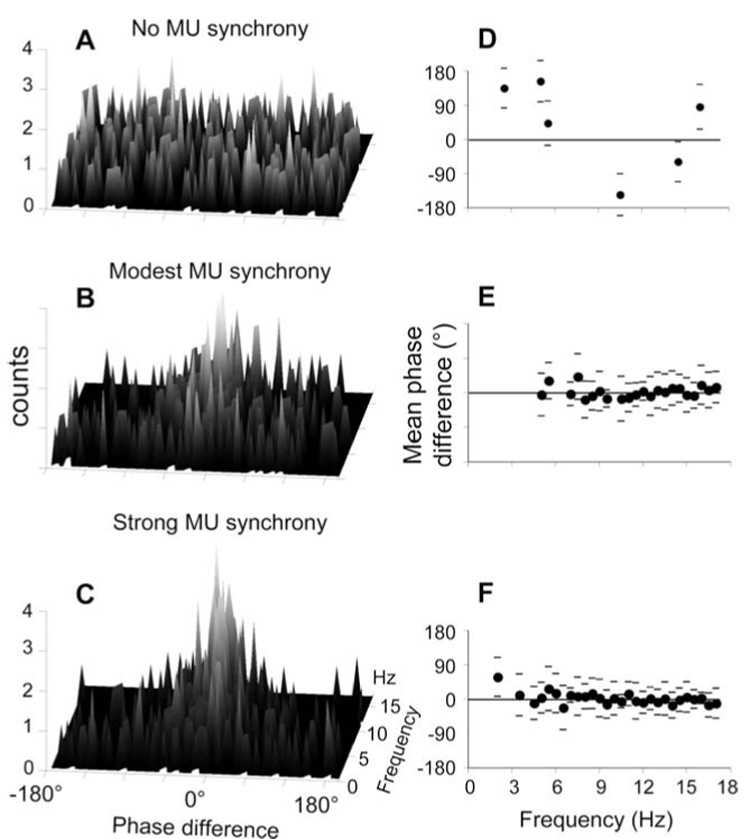
Fig. 5A–F.

Between‐forces phase differences and circular statistics. A, B and C show the phase differences between the pair of simulated forces for no motor unit synchrony, modest motor unit synchrony and strong motor unit synchrony, respectively. Phase differences from all trials (n=10) are plotted as 3‐D histograms for each frequency (n=34) from 0.5 to 17 Hz. For graphical purposes, phase differences were binned into 5° intervals. D, E and F show the mean phase difference ± angular deviation (filled circles and horizontal lines, respectively) computed on phase difference distributions shown in A, B and C, respectively. Note that mean phase difference values are shown only for significant phase difference distributions
