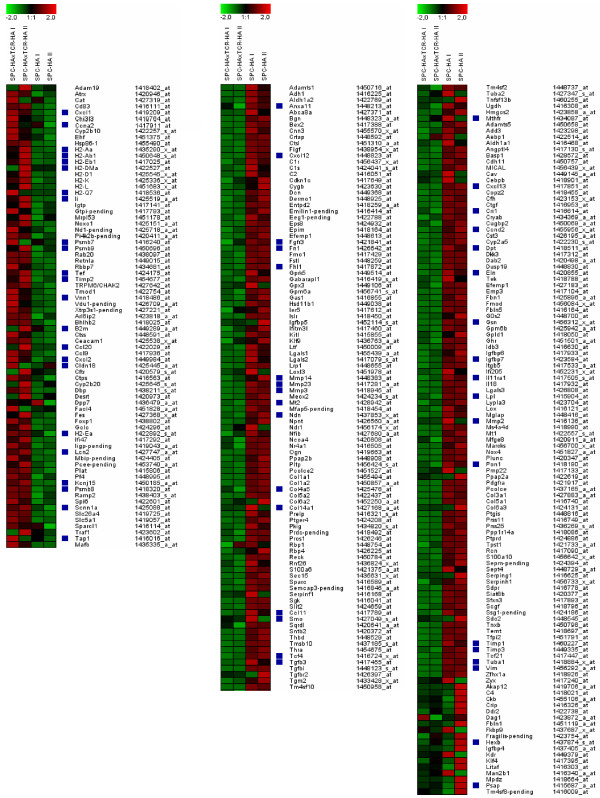
Figure 4.
Heat map including genes differentially expressed in AEC II cells isolated from lungs of diseased SPC-HA/TCR-HA as well as healthy SPC-HA mice. Red indicates induction of gene expression, green indicates repression (+2: bright red; -2: bright green). Black indicates no changes. Blue squares indicate genes further highlighted in Table 1. Genes were considered to be regulated whose expression was at least twofold increased or decreased.

