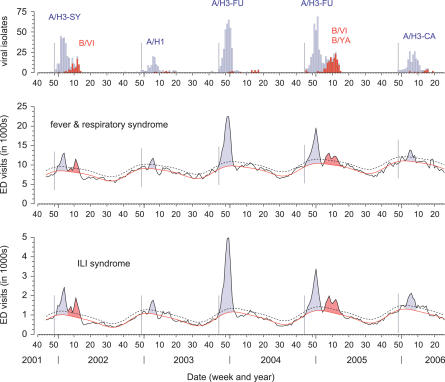
Figure 1. Weekly Influenza Isolates and ED Fever and Respiratory and ILI Visits in New York City during the 2001–2002 to 2005–2006 Seasons.
Dates are CDC year and week ending Saturday. Top graph, isolates by influenza type are from WHO collaborating laboratories, with subtype and strain designation based on predominant regional and national antigenic lineage: A/H3-SY, predominant circulating A(H3N2) Sydney-lineage viruses; B/VI, predominant circulating B/Victoria-lineage; A/H1, either A(H1N1) New Caledonia- or A(H1N2) Wisconsin-lineage; A/H3-FU, A(H3N2) Fujian-lineage; B/YA, B/Yamagata-lineage; and A/H3-CA, A(H3N2) California-lineage. Middle and bottom graphs, observed fever and respiratory syndrome (middle) and ILI syndrome (bottom) ED visits are shown as black lines, and seasonally expected Serfling baseline visits as red lines. Dashed lines represent epidemic thresholds as model estimates plus two standard deviations. Shaded areas represent estimated influenza-attributable excess ED visits: blue areas correspond to periods of increasing and dominant influenza A circulation and red areas to influenza B. Vertical lines indicate the first week of continuous influenza isolate reporting each season.

