
FIG. 3.
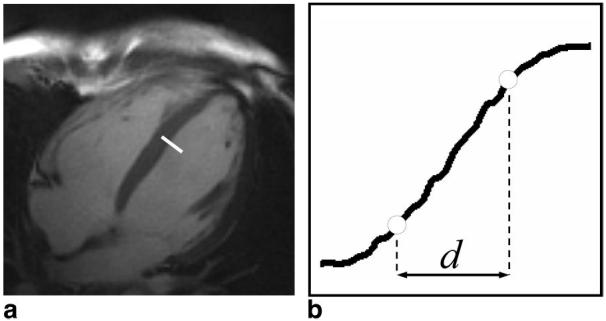
Example line drawn across the septum to left ventricle blood pool boundary (a) used to generate a profile for assessment of edge sharpness (b). Open circles represent the 20% and 80% positions between the maximum and minimum intensity values of the profile.