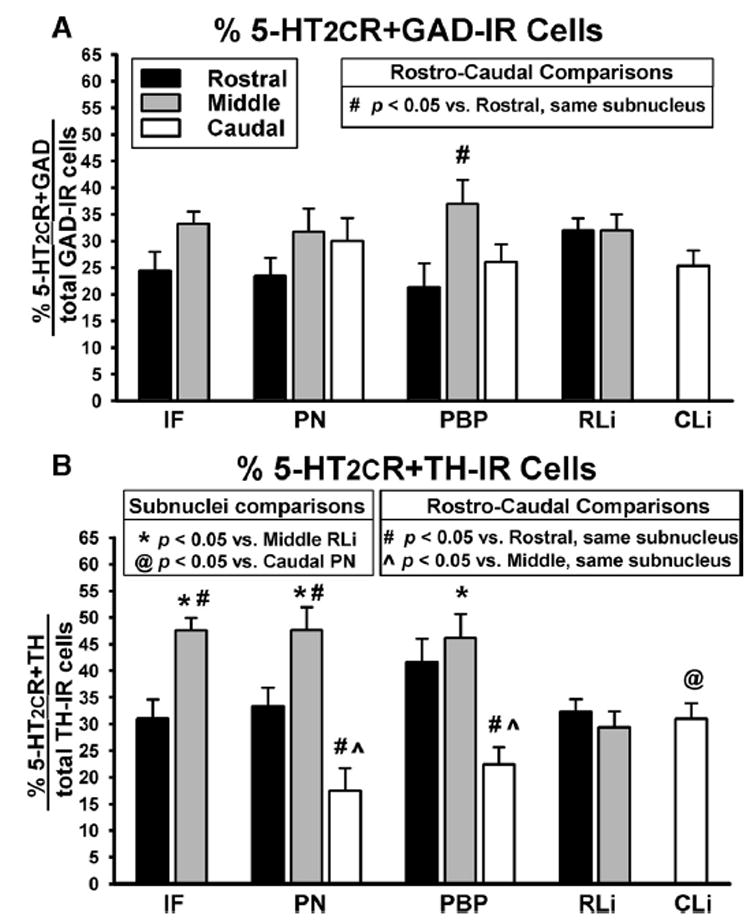
Fig. 4.

Percentage of 5-HT2CR+GAD and 5-HT2CR+TH co-localized cells in the various VTA subnuclei. Data represent the mean (±S.E.M.; n=7–12/group) percentage of (A) 5-HT2CR+GAD co-localized cells and (B) 5-HT2CR+TH co-localized cells in the rostral (black bars), middle (gray bars) and caudal (white bars) levels of the VTA subnuclei. Data were calculated by dividing the % of co-labeled cells by the total number of GAD- or TH-labeled cells, respectively, in each subnucleus for each VTA tissue section. Resultant values were averaged for the rostral, middle and caudal levels of each subnucleus. For analyses comparing the expression of co-localization among the different rostro-caudal levels of each subnucleus: # P<0.05 compared with the rostral level of the same subnucleus; P<0.05 vs. middle level of the same subnucleus. For analyses comparing the expression of co-localization between the various subnuclei for each rostro-caudal level: * P<0.05 vs. middle RLi; @ P<0.05 vs. caudal PN.
