
Fig. 5.
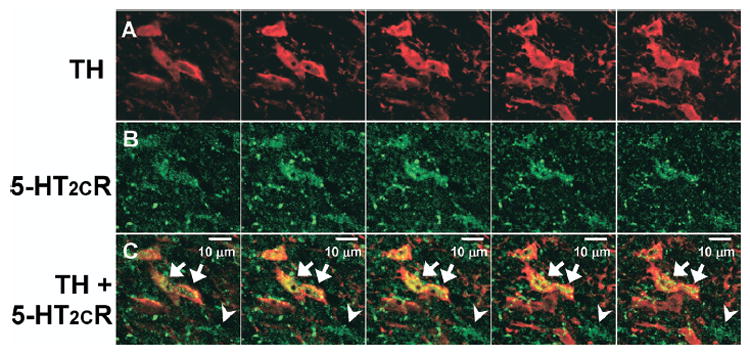
Co-localization of TH and 5-HT2CR IR. Series of five sequential photomicrographs (from left to right) captured using a confocal microscope displaying TH (A; red) and 5-HT2CR (B; green) IR in the VTA. (C) Overlay of images in A and B shows co-localization of TH+5-HT2CR IR (yellow) as indicated by arrows. Arrowheads point to a 5-HT2CR-IR cell that is devoid of TH-IR. Scale bar=10 μm.