
Fig. 4.
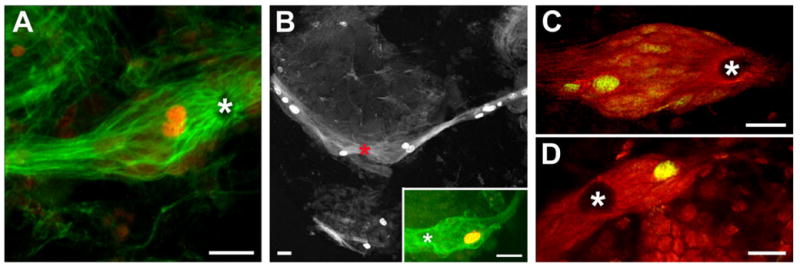
The glial soma cluster contains mitotically active cells. A,B: BrdU labelling (red in A) within the glial soma cluster in animals exposed to BrdU for 2 weeks. Glutamine synthetase (green) labelling is also shown in A. The inset in B shows a cell within the cluster labelled for phosphohistone H3 (Thr11), an M-phase marker. Asterisk marks the vascular cavity. C,D: A G1-phase marker, MCM2–7 (green), labels cells in the lateral (C) and medial (D) glial subpopulations. Glutamine synthetase (red) labelling is also shown. Asterisks mark the vascular cavity. Scale bars = 25 μm.