
Fig. 5.
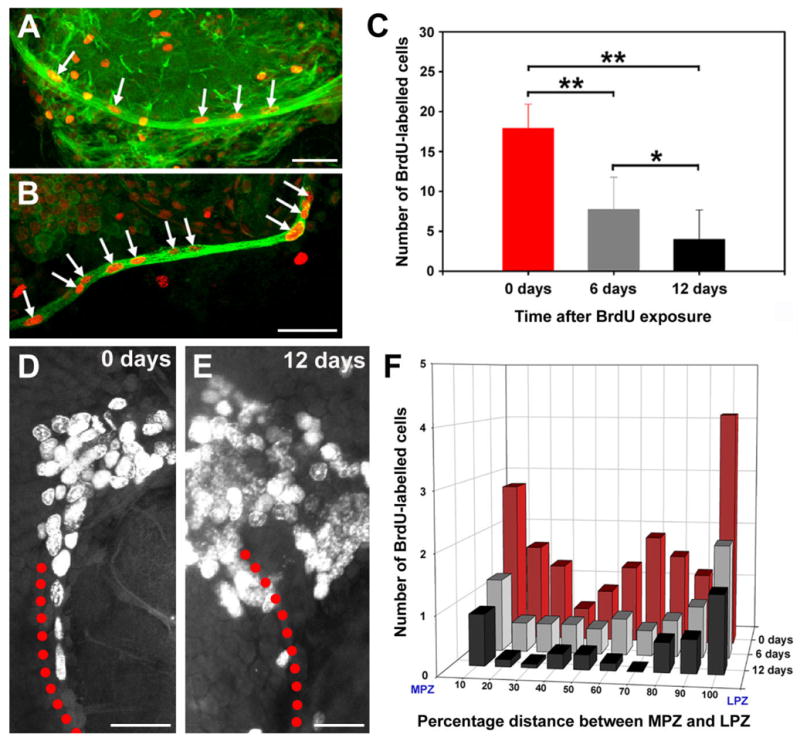
The glial tracts are migratory pathways. A,B: BrdU (red), β-tubulin (green in A), and glutamine synthetase (green in B) labelling of the glial tracts projecting to the LPZ (A) and MPZ (B) shows that the tracts contain BrdU-labelled cells. C: Histogram showing the numbers of BrdU-labelled cells within the glial tracts 0, 6, and 12 days after exposure to BrdU (mean ± SD). The number of labelled cells decreased significantly over time (P < 0.0001 by one-way ANOVA; F = 41.3, 38 d.f.). Significant differences between groups are marked with a single (P < 0.01, t-test) or double (P < 0.0001, t-test) asterisk. D,E: BrdU labelling in the LPZ and associated glial tract 0 (D) and 12 (E) days after BrdU exposure. Red dots outline the path of the tract. F: Distribution of BrdU-labelled cells within the glial tracts over time. Scale bars = 50 μm in A,B; 40 μm in D; 25 μm in E.