
Fig. 1.
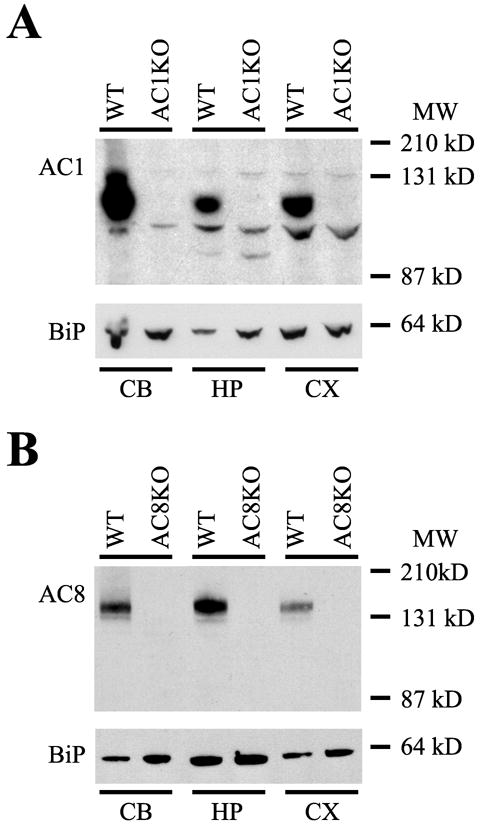
Protein immunoblot analysis of AC1 and AC8 expression. Abundant protein expression of both AC1 and AC8 was detected in membrane-enriched protein extracts from the cerebellum (CB), hippocampus (HP) and cortex (CX) of the adult mouse brain. (A) A single immunoreactive band at ~123 kD, representing AC1 protein was detected in all WT but not AC1KO samples. (B) A single immunoreactive band at ~135 kD, representing AC8 protein was detected in all WT but not AC8KO samples. Equal loading conditions were verified by immunodetection for binding protein (BiP). MW, Molecular weight.