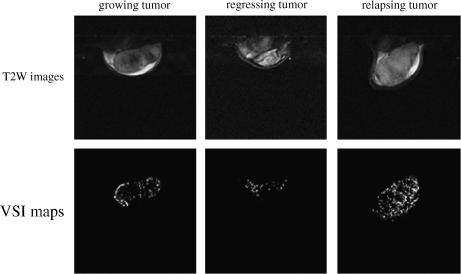
Figure 2.
Axial cross-sections (top row) and VSI maps (bottom row) for a representative tumor at the growing (left column), regressing (middle column), and relapsing (right column) stages of the tumor growth cycle. The average VSI value was 44 µm for the growing tumor, 6 µm for the regressing tumor, and 92 µm for the relapsing tumor.

