
Figure 1. miR-34a is induced by p53 following DNA damage.
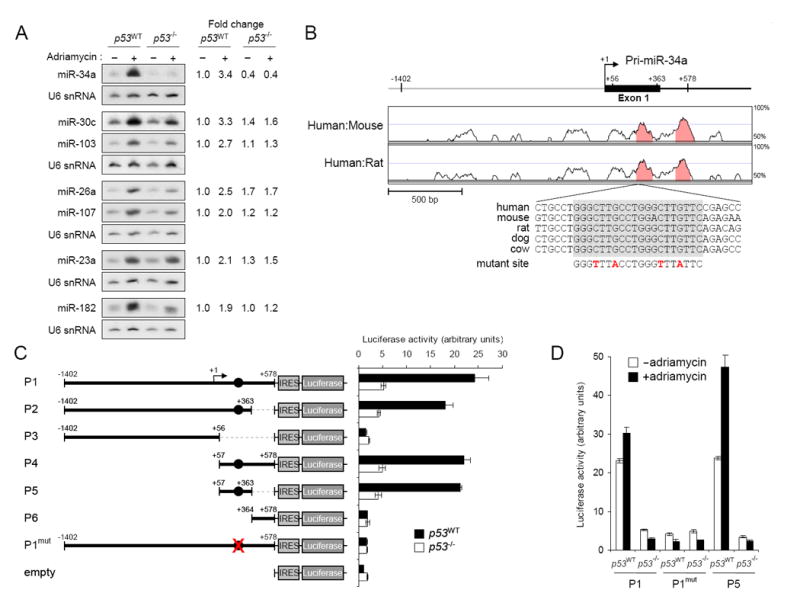
(A) Northern blot analysis of miRNA expression in p53WT and p53-/- HCT116 cells with or without adriamycin treatment. Quantification of the miRNA signals under each condition, normalized to U6 snRNA expression, is shown on the right.
(B) Phylogenetic conservation of the genomic region near the transcription start site of the miR-34a primary transcript. VISTA (http://genome.lbl.gov/vista/index.shtml) was used to generate pairwise alignments between human and mouse and human and rat. The graph is a plot of nucleotide identity for a 100 base-pair sliding window centered at a given position. Position +1 of pri-miR-34a is the most 5′ transcription start site mapped. The magnified sequence shows the location and evolutionary conservation of the p53 binding site (in gray box). Mutations introduced into the promoter reporter construct (P1mut in panel C) are shown in red.
(C) Activity of promoter constructs in p53WT and p53-/-cells. The arrow above construct P1 indicates the position of the transcription start site. Filled circles show the position of the p53 binding site. Error bars represent standard deviations from three independent transfections each measured in triplicate.
(D) Genotoxic stress activates the miR-34a promoter. The indicated promoter constructs were transfected into p53WT or p53-/- cells with or without subsequent exposure to adriamycin.