
Figure 2. Expression of miR-34a promotes apoptosis.
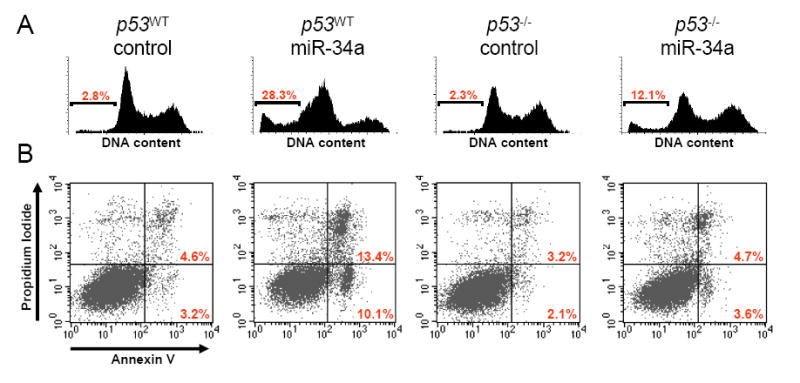
(A) p53WT and p53-/- cells were transfected with synthetic miR-34a or a control oligonucleotide and DNA content was monitored by flow cytometry. The fraction of apoptotic cells (sub-G1) is indicated.
(B) Cell death was monitored by Annexin V staining and flow cytometry. The right lower quandrant of each plot contains early apoptotic cells whereas the right upper quadrant contains late apoptotic cells. This experiment was repeated three independent times and similar results were obtained each time. Panels (A) and (B) come from two separate experiments.