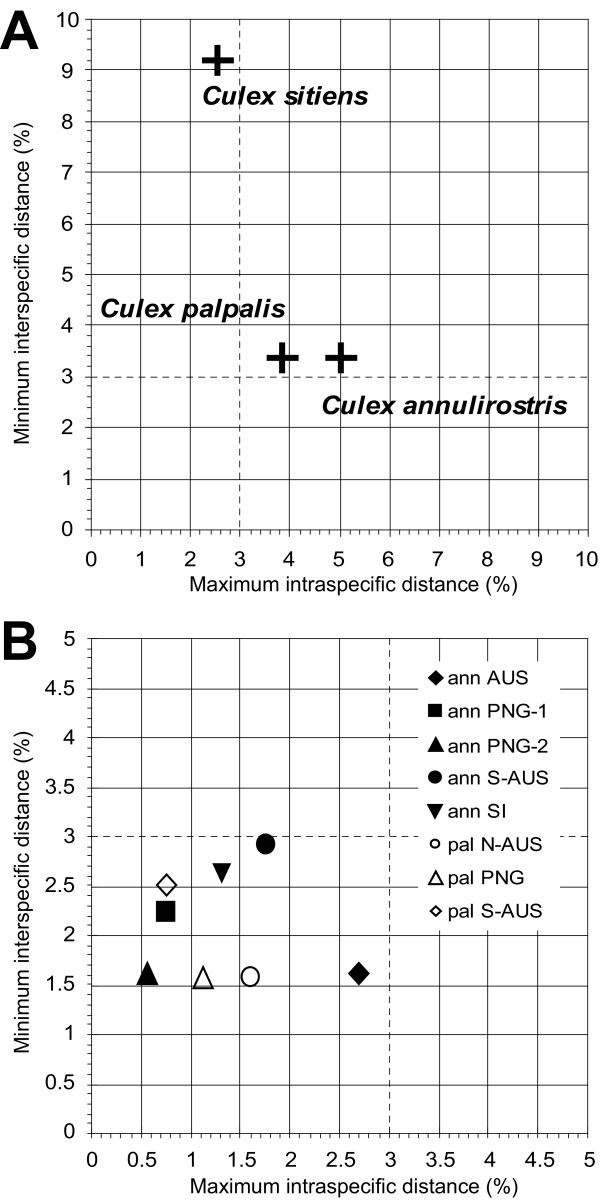
Figure 3.
Intraspecific vs. interspecific distance of COI sequence from Cx. annulirostris,Cx. palpalis and Cx. sitiens. (A) Morphological taxa maximum intraspecific distance was compared to the minimum interspecific congeneric difference (Kimura 2 distance). (B) The morphological taxa were divided into several proposed lineages and their maximum intra-lineage distance was compared to the minimum inter-lineage difference. For both graphs the 3% threshold is highlighted, dividing the graph into four quadrants that represent different categories of "species" [15]: top left – species concordant with current taxonomy; top right – probable composite species, i.e. candidates for taxonomic split; bottom left – species that have undergone recent divergence, hybridization, or synonymy; bottom right – probable specimen misidentification.

