Figure 3.

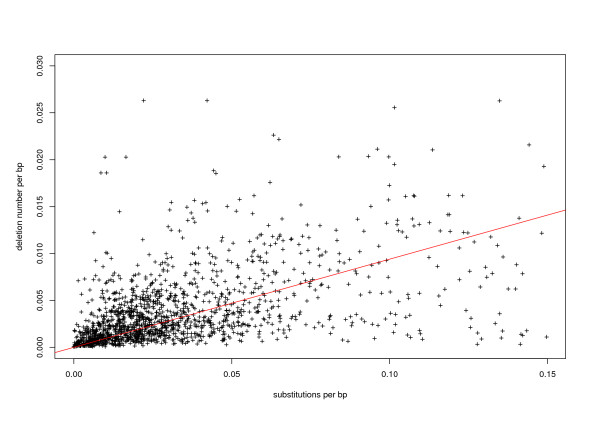
Relationship between divergence and deletion number per nucleotide. The slope corresponding to the maximum likelihood estimate of the deletion rate relative to substitutions (0.094) is represented in red.

Relationship between divergence and deletion number per nucleotide. The slope corresponding to the maximum likelihood estimate of the deletion rate relative to substitutions (0.094) is represented in red.