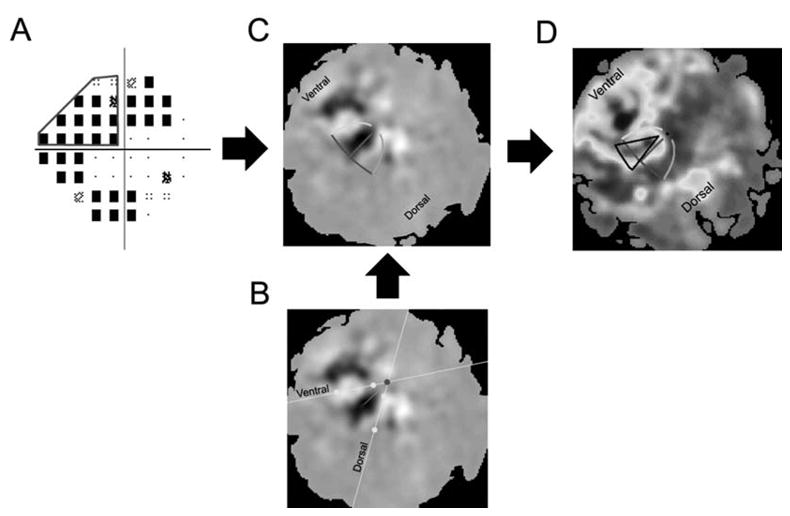
Figure 3. Projecting regions of visual space onto V1.

A: Pattern deviation plot of SAP thresholds for the glaucomatous eye of the Patient 6 from Figure 2. A region of visual space in the upper left quadrant was selected with the intent of projecting that region onto the flattened cortex (bold line). B: The initial stages of fitting retinotopic fMRI data. FMRI responses to the meridian mapping stimuli are pictured in gray. White pixels denote responses that were in phase with stimulation of the vertical meridian. Black pixels denote responses that were in phase with stimulation of the horizontal meridian. The experimenter selected two points along the activity patterns for each vertical meridian (yellow dots). The software automatically fit lines (yellow lines) to the points selected and then computed the intersection of those points (red dot), which was assumed to be near the representation of the fovea. The experimenter then selected a point along the activity pattern of the horizontal meridian (blue dot). The software automatically connected the foveal representation with the point along the horizontal meridian (green line). A generic template was positioned and rotated according to the values computed during this stage of the fitting process. C: Template superimposed upon fMRI responses to the meridian-mapping stimuli. After the generic template was generated, each component of the template was fit using an iterative least-squares method (see Figure 3). The template was then used to project regions of visual space onto the flattened cortex. D: The projected scotoma as a ROI. The best-fitting template is presented along with the projected scotoma (black lines) atop the fMRI responses to the scotoma-mapping stimulus (see Figure 5).
