
Figure 7. Pointwise comparison of fMRI data and visual thresholds.
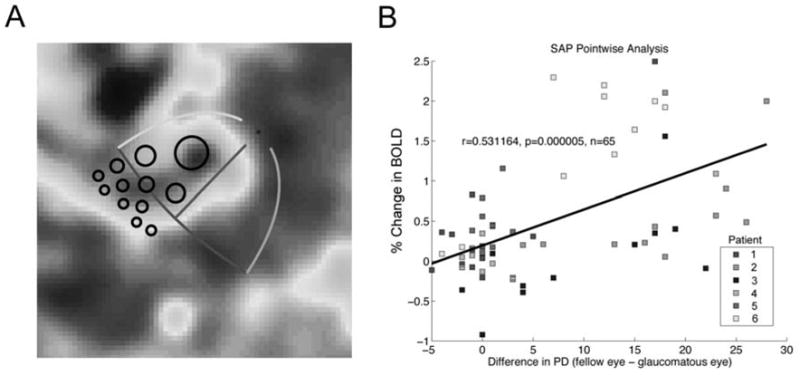
A: ROIs for the pointwise comparison. Twelve individual ROIs for each patient were derived from twelve test locations from the automated perimetry. For each test location, a 6º-diameter region of visual space was projected onto the flattened representation of cortex using the best-fitting template for each patient. The amplitude of the BOLD signal for voxels within the ROI was compared to corresponding points from the automated perimetry. B: Pointwise correlation between fMRI data and SAP. The difference between PD values for the glaucomatous and fellow eyes were computed for 12 test locations within the damaged visual quadrant. These difference scores were compared to the percent change in BOLD amplitude of the voxels within the corresponding ROI. Each point represents a comparison between the change in BOLD amplitude within a single ROI to the PD difference score for a single test location in one patient. There was a pointwise correlation between the fMRI data and SAP data. The color of each point indicates the responses from each patient.