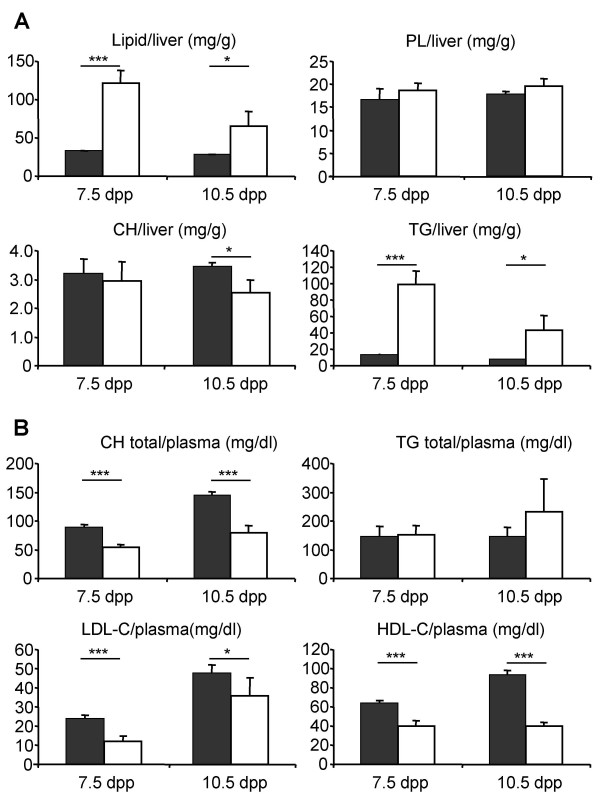
Figure 4.
Quantification of lipids in the liver and plasma of Sco5/Sco5 mutants. Lipids were quantified from the liver (A; 5 individuals per genotype) and from the plasma (B; 10 individuals per genotype) of mutant and wild-type littermates at 7.5 and 10.5 dpp. Concentrations are indicated as a mean ± s.e.m and expressed as mg/g of tissue or mg/dl respectively. PL, CH, TG for plasma lipids, cholesterol, triglycerides. HDL-C and LDL-C for cholesterol associated respectively with HDL and LDL.

