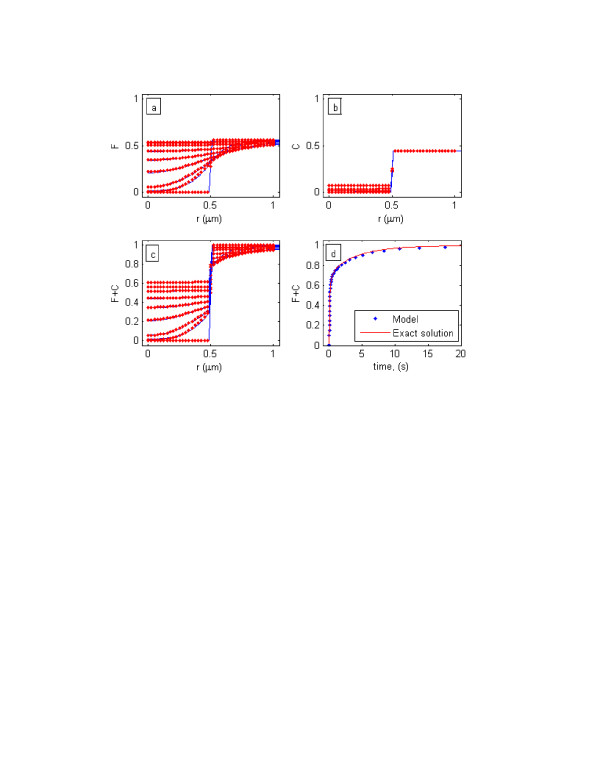
Figure 1.
Spatial and temporal distributions of GFP-GR inside bleach spot after photo-chemical bleaching during time course of a FRAP experiment. The Figure shows comparison of the analytic solution (solid lines) and numerical model (dots) at times of 0, 0.01, 0.02, 0.05, 0.1, 0.2, 0.5, 1, and 2 seconds for free GFP-GR (a), bound complex (b), and total GFP-GR (c). Validation of the numerical model (dots) with the analytic solution (solid lines) of [25] is depicted in (d). The graph presents average normalized fluorescent intensity, obtained by equation (16), inside the bleach spot.

