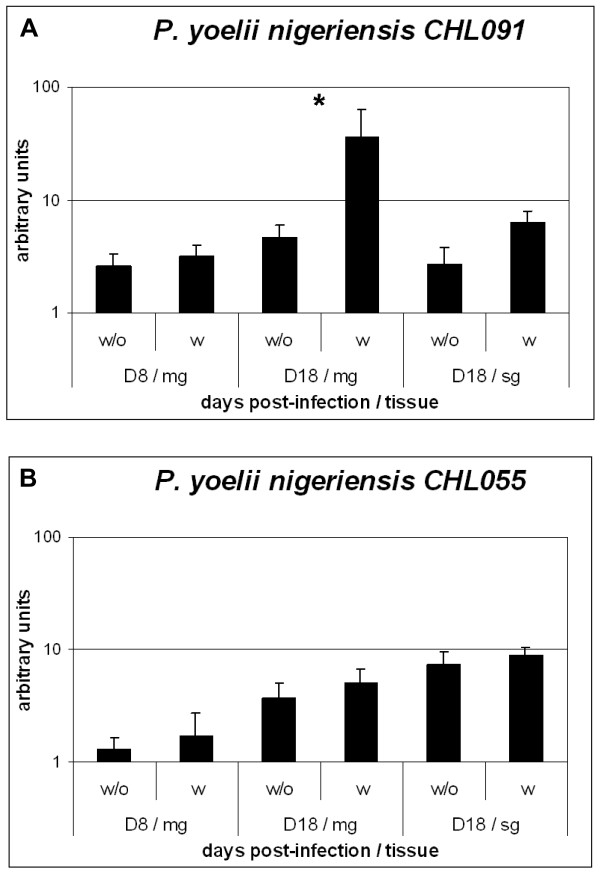
Figure 3.
Expression levels of two P. y. nigeriensis transcripts isolated by DDRT-PCR. A) expression profile of the differential display cDNA transcripts corresponding to clone Pyn_chl091; B) expression profile of the differential display cDNA transcripts corresponding to clone Pyn_chl055. Quantification of cDNA was determined against a standard curve and normalized with the expression of Pyldh. Values represent the mean and standard error of 4 independent experiments. w - with chloroquine treatment; w/o - chloroquine treatment; D8 - day 8 post-infection; D18 - day 18 post-infection; mg - midgut; sg - salivary glands. * Represents statistic significance.

