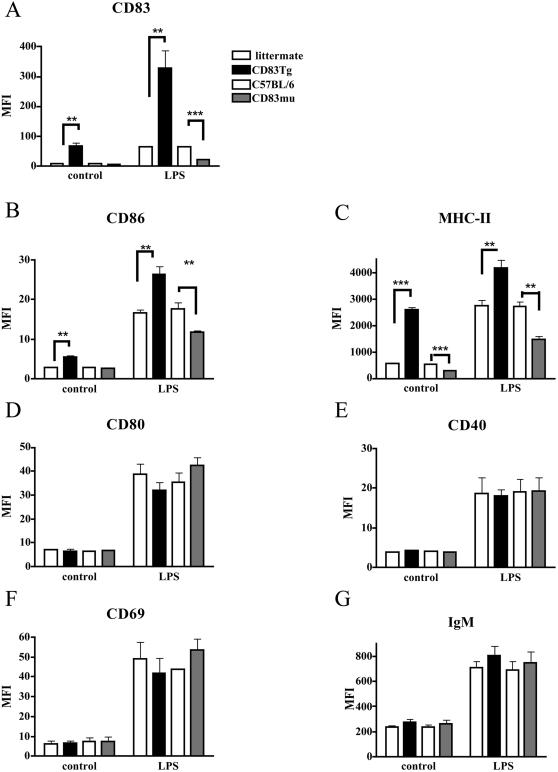
Figure 2. Positive correlation of CD83 expression to CD86 and MHC-II expression on CD83Tg and CD83mu B cells.
C57BL/6 and CD83 negative littermates to CD83Tg founder 1 mice (open bars), CD83Tg (black bars) or CD83mu (dark grey bars) derived spleen cells (2×10⁶/ml) were double stained for CD19 and either CD83 (2A), CD86 (2B), MHC-II (2C), CD80 (2D), CD40 (2E), CD69 (2F) or IgM (2G) ex vivo or after 48 h incubation with 10 µg/ml LPS as indicated on the x axis. 2×10⁴ CD19 positive cells were analyzed by FACScan. Please note that each bar represents the combined results of five independent experiments employing two female age matched mice of each group per experiment, error bars show SEM. Asterisks indicate a significant difference of the mean (* p<0.05; ** p<0.005; *** p<0.0005) employing students t test.

