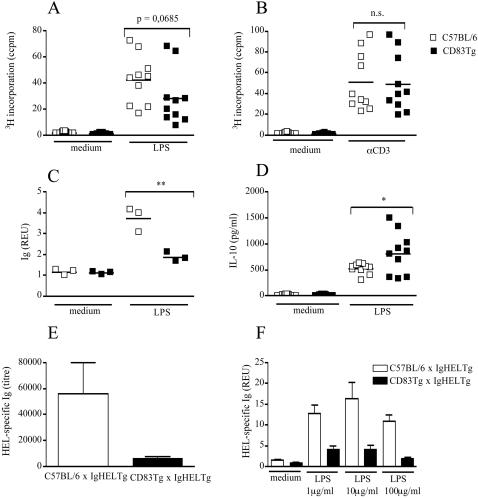
Figure 3. CD83Tg spleen cells display reduced Ig and increased IL-10 response to LPS stimulation.
3A-D: 2×10⁵ spleen cells derived from sex and age matched C57BL/6 (open squares) or CD83Tg founder 2 (closed squares) were cultured in the presence of LPS (10 µg/ml) or anti-CD3 (145-2C11, 1 µg/ml) or no further stimulus, as indicated on the x-axis. 3AB: Proliferation was estimated after 48h by 3H thymidine incorporation. 3C: Total mouse Ig in the supernatant was measured after seven days by ELISA. Results are presented as relative ELISA units (REU: OD450 sample: OD450 medium control) of a 1∶1024 dilution. 3D: IL-10 in the supernatant was quantified by ELISA after 48 h. Each dot represents the analysis of an individual mouse (mean of five replicates the SEM not shown, being below 10%). The lines indicate the median of all mice analyzed and the asterisks indicate a significant difference of the median (*p<0.05; **p<0.005) employing students t test. 3E: HEL-specific Ig in the serum of six IgHEL Tg mice (open bar) or six IgHEL CD83double Tg mice (black bar) was quantified by ELISA, error bars indicate SEM. 3F: 2×10⁵ spleen cells derived from six IgHEL Tg mice (open bars) or from spleen cells derived from IgHEL CD83 double Tg mice (black bars) were cultivated in vitro for 48 h in the presence of indicated amounts of LPS. HEL-specific Ig in the supernatant was quantified by ELISA and is presented as REU of a 1: 40 dilution. Error bars show SEM of five replicates. This result is representative for five independent experiments.

