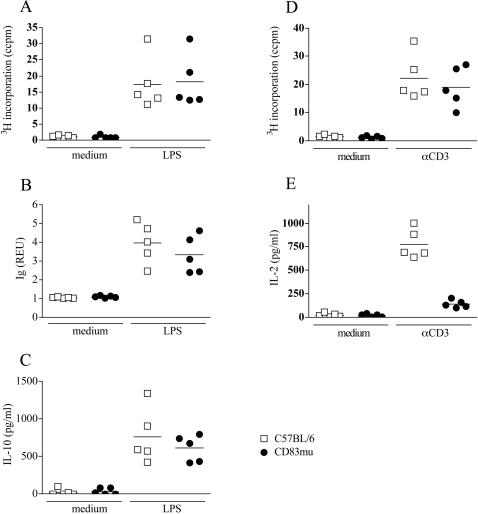
Figure 5. In vitro stimulation of CD83mu spleen cells.
2×10⁵ spleen cells derived from C57BL/6 (open squares) or CD83mu (closed circles) mice were cultured in the presence or absence of LPS (1 µg/ml) as indicated on the x-axis. 5A: Proliferation was estimated by 3H thymidine incorporation after 48h culture. 5B: Total mouse Ig in the supernatant was measured after seven days by ELISA and results are presented as REU of a 1:200 dilution. 5C: IL-10 in the supernatant was quantified by ELISA after 48 h. 5DE: spleen cells were cultured in the presence or absence of anti-CD3 (1 µg/ml). Proliferation (5D) and IL-2 secretion (5E) were measured after 48h culture. Each dot represents an individual experiment performed in five replicates SD being below 10%, the bars indicate the median of all five experiments performed.

