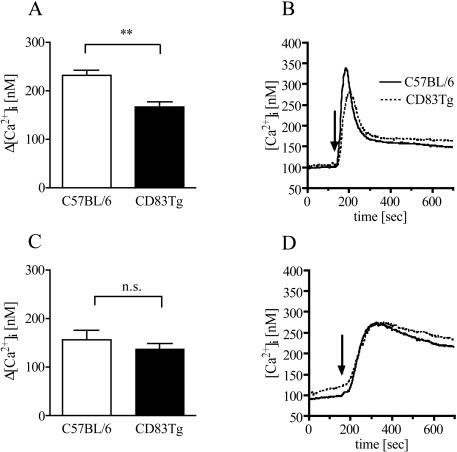
Figure 7. Reduced calcium signaling in CD83Tg B cells.
Untouched B (7AB) or T cells (7CD) were isolated from pooled spleens of two 8–10 week old sex matched C57BL/6 (open bars) and CD83Tg (black bars) mice. Purified B and T cells were loaded with Fura-2-AM and stimulated with anti-ΒCR (Lo-MK) or anti-CD3 (145-2C11) respectively (10 µg/ml each). [Ca2+]i was calculated from the fluorescence intensity ratio at 340 and 380 nm. 7AC: Bars represent the combined results from nine independent measurements, error bars show SEM. Asterisks indicate a significant difference of the mean. 7BD: Shown is a characteristic calcium tracing from a single experiment for B cells (7B) and T cells (7D) obtained from C57BL/6 (solid line) or CD83Tg (dotted line) mice.

