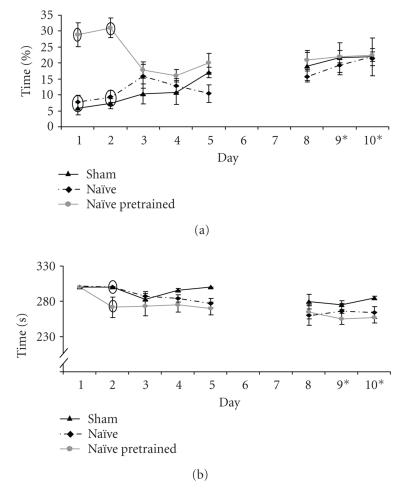
Figure 3.
Examples of behavior of the mice during the followup experiment. (A) Percentage of time spent on center board. (B) Time to finish the task (5 minutes or finding all three baits) of sham (black line), naïve (striped black line), and naïve mice preexposed to a bait-containing cylinder in the homecage (grey line). Days 9 and 10 on the x-axis indicate removal of rings from all cylinders, while the bait remained in the same cylinders. Data present the mean of the three trials per day ± SEM. Ovals mark data points with significant differences: P < .05 between groups within days.

