FIGURE 1.

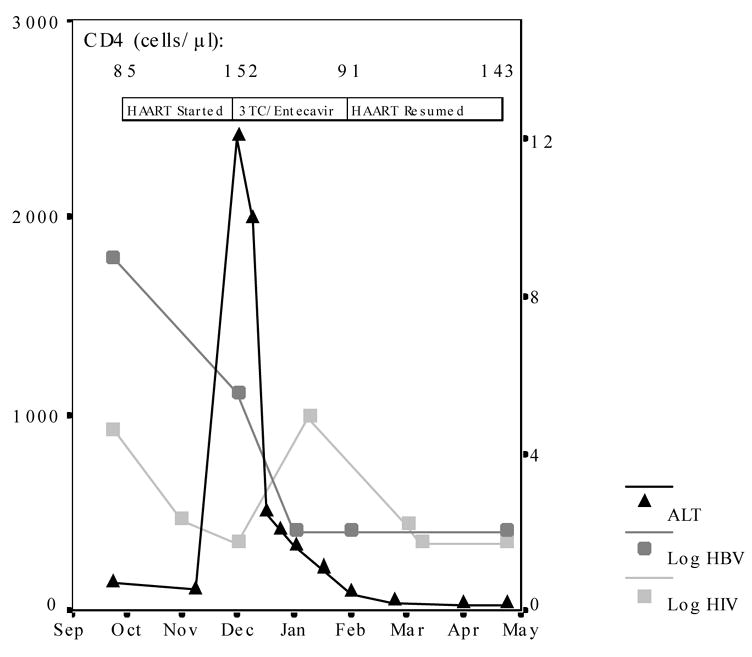
Alanine aminotransferase levels (ALT; left axis), log HBV DNA level (right axis), and log HIV RNA level (right axis) are presented over time. Treatment regimen and CD4 T-cell count at the time therapy was changed is also indicated.

Alanine aminotransferase levels (ALT; left axis), log HBV DNA level (right axis), and log HIV RNA level (right axis) are presented over time. Treatment regimen and CD4 T-cell count at the time therapy was changed is also indicated.