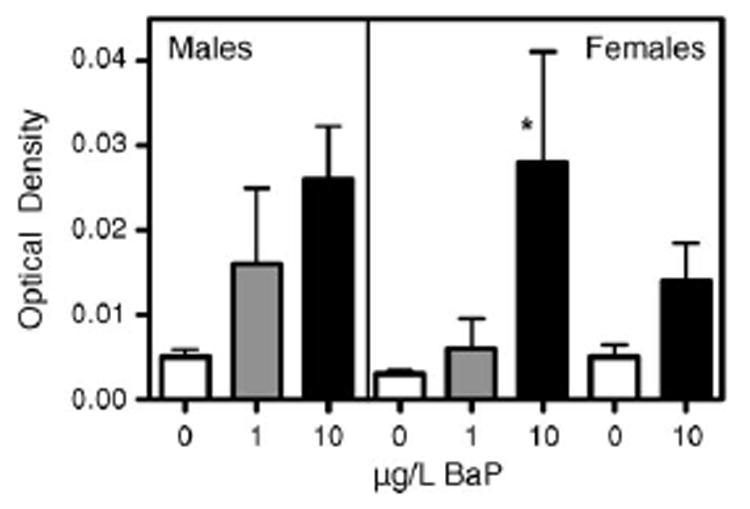
Fig. 5.

CYP1A protein measured by Western blot analysis in the liver of killifish exposed to aqueous BaP for 15 days. Males from winter exposure and females from both winter and summer exposures are shown. Ethanol (180 μL) was used as the solvent control. Results are expressed as the optical density (OD) ±S.E. for the 4–6 samples from each treatment group. OD was measured using VersaDoc software, *p < 0.05.
