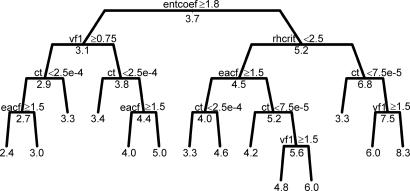
Fig. 2.
Regression tree for equilibrium CS as a function of parameter, hardware, and software variation. The tree is read from top to bottom, starting with all model runs. At each split in the tree, the model runs are divided into two groups based on the statement given (either an inequality, for continuous variables, or an equality, for discrete variables). If the statement is true for any given model run, it passes to the left, if false, it passes to the right. The average CS for the subset of the model runs reaching that point is given below the split or tip. This tree is a subset of the optimal tree (fully defined in SI Table 3) and explains 64% of the variation in CS, whereas the optimal tree explains 80%. Hardware/software explanatory variables were included in the creation of this tree and do appear in the optimal tree. However, this subset only contains splits based on model parameters.

