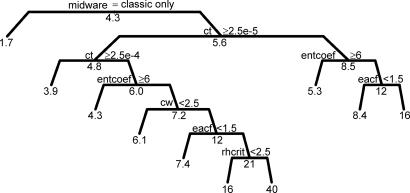
Fig. 6.
Regression tree for percentage CV in CS among model runs with identical parameters and starting conditions. The tree is read from top to bottom in the same way as Fig. 2, starting with the 4,712 parameter and starting condition sets where a CV could be calculated. Full details are given in SI Table 5.

