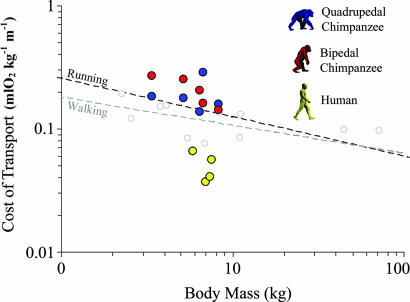
Fig. 1.
Net cost of transport (ml of O2 kg−1 m−1) for chimpanzee quadrupedal walking (blue), chimpanzee bipedal walking (red), and human walking (yellow). Dashed lines indicate trendlines for running and walking in birds and mammals. The running trendline is for 65 terrestrial species (15). Walking data (open symbols) were collected from the literature [see supporting information (SI) Table 2].

